-
Showing the analytic charts of the property
$1.0
![black-knight Black Knight](https://realtyna.com/wp-content/uploads/2018/02/black-knight.png)
Analytics are driving the real estate market.
Your site should be no different.
With the Property Analytics Add-on you can empower your clients with real estate data and keep them browsing longer.
Leads leave websites when they don’t get the information they need.
Black Knight data include:
-
Total Pre-Foreclosures and Foreclosures
-
Total number of homes sold by property type
-
Total number of homes sold by square foot
-
Total number of homes sold by median sales price
-
Unit sales by year built
-
Valuation changes by zip or neighborhood
![analytics Google Analytics](https://realtyna.com/wp-content/uploads/2018/02/analytics.png)
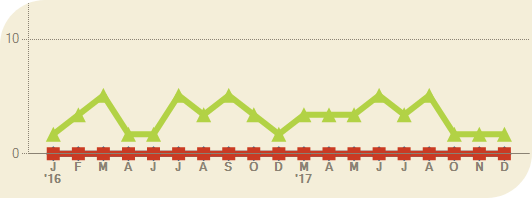
Each dataset is integrated into the property listing page.
It includes a graph or chart to show changes over time and
provide more context.
![map-and-placeholder Property On Map](https://realtyna.com/wp-content/uploads/2018/02/map-and-placeholder.png)
As a real estate agent, its important to provide useful content
on your site. Property Analytics Add-on with Black Knight
data can help you retain more leads, improve your search
engine website ranking, and get ahead of your competition.
![black-knight-graphs Real Estate graph in Black Knight](https://realtyna.com/wp-content/uploads/2018/02/black-knight-graphs.png)
Note:
In order to use the Property Analytics Add-on you need to obtain an API with Black Knight.
For pricing and detailed information please check: www.blackknightinc.com.
-
Showing the analytic charts of the property
$1.0